
What's the Deal with Trade & Tariffs?
by Will Becker, AWMA/AIF
Happy Friday!
Investment Perspective
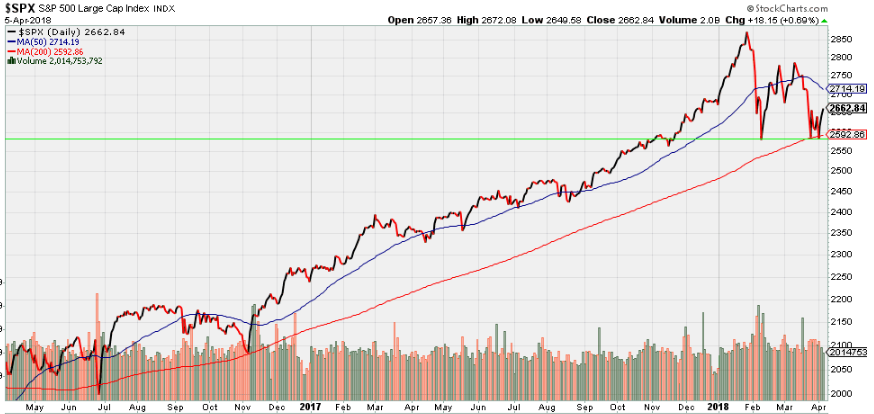
ADP Employment data is strong, the Chicago Federal Reserve reports that economic growth increased in February, auto sales are up in March, and S&P 500 Earnings estimates are at record-high levels. So why are US Stock markets acted like drunken sailors, with the S&P 500 falling -2.5% since March 1st and re-testing the low from February 8th, 2018 (horizontal Green line below)?
We are beginning to see hints of the conditions that can lead to recession, namely raising interest rates late in a cycle, narrowing yield curve, already high levels of variable debt that reduce consumer spending as interest rates rise and make a market decline worse, and tougher tariffs. Those happen to be hallmarks of what went wrong in the Great Recession, so you know, we take notice. Notably absent are high inflation, falling employment, and falling earnings. In an odd irony, the increase in corporate profits and onshoring of corporate cash may lead to a scenario where the economy gets over-heated and Federal Reserve raises interest rates faster to cool off the economy.... so, in some ways a recession may happen for news that is initially either good or bad. That part is not clear yet, but what is clear is that tariffs are in the news. So, let's dig into those.
This year, President Trump announced increased tariffs on solar panels, washing machines, steel, aluminum, and 1,300 other products. Many countries were later exempted from those tariffs, but at the moment China is the main target. China responded with tariffs on US airplanes, cars, and soybeans. And that is how tariff arguments happen - they are oddly specific, constantly changing, and morph into something completely different. This video, for example, talks about how a chicken tariff turned into a car tariff. Lest anyone think that we have true free trade, note that "the International Trade Commission lists over 12,000 specific tariffs on imports to America." This includes a broad variety of items, from Paper clips to canned tuna to twine.
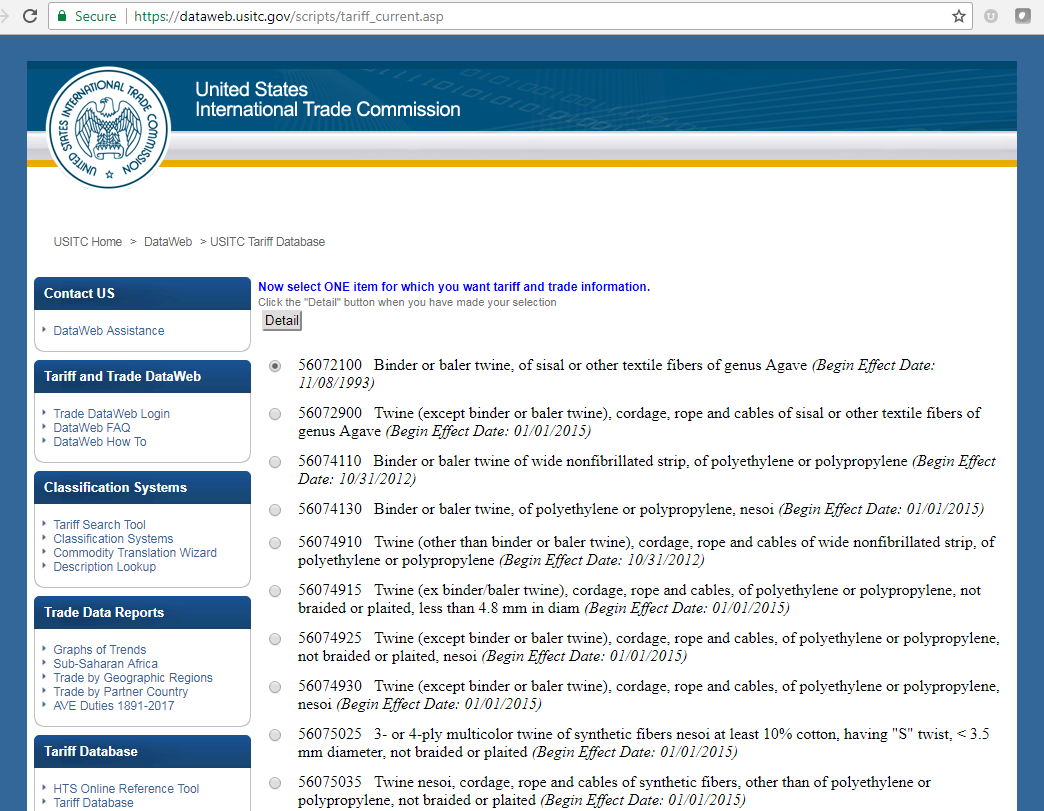
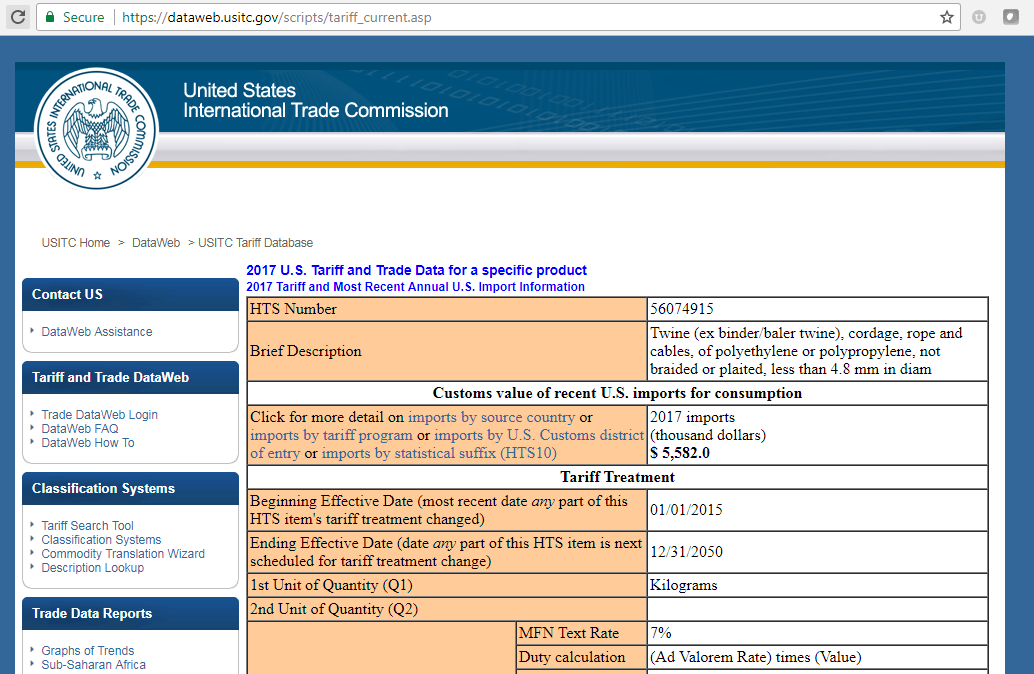
Yes, even twine. Following World War II, the major economies realized that more economic integration mean less likelyhood of war. So they created the General Agreement on Trade & Tariffs, or GATT, in 1948. That later turned into the World Trade Organization (WTO). Today, anyone with an internet connection can look up the vast array of tariffs via the US International Trade Commission. There I found 26 tariffs for the keyword "Twine", with the Top 10 shown below. I picked one oddly specific tariff having to do with Twine that is less than 4.8mm in diameter, and found that Canada and China provide nearly half of the international supply. Go figure.
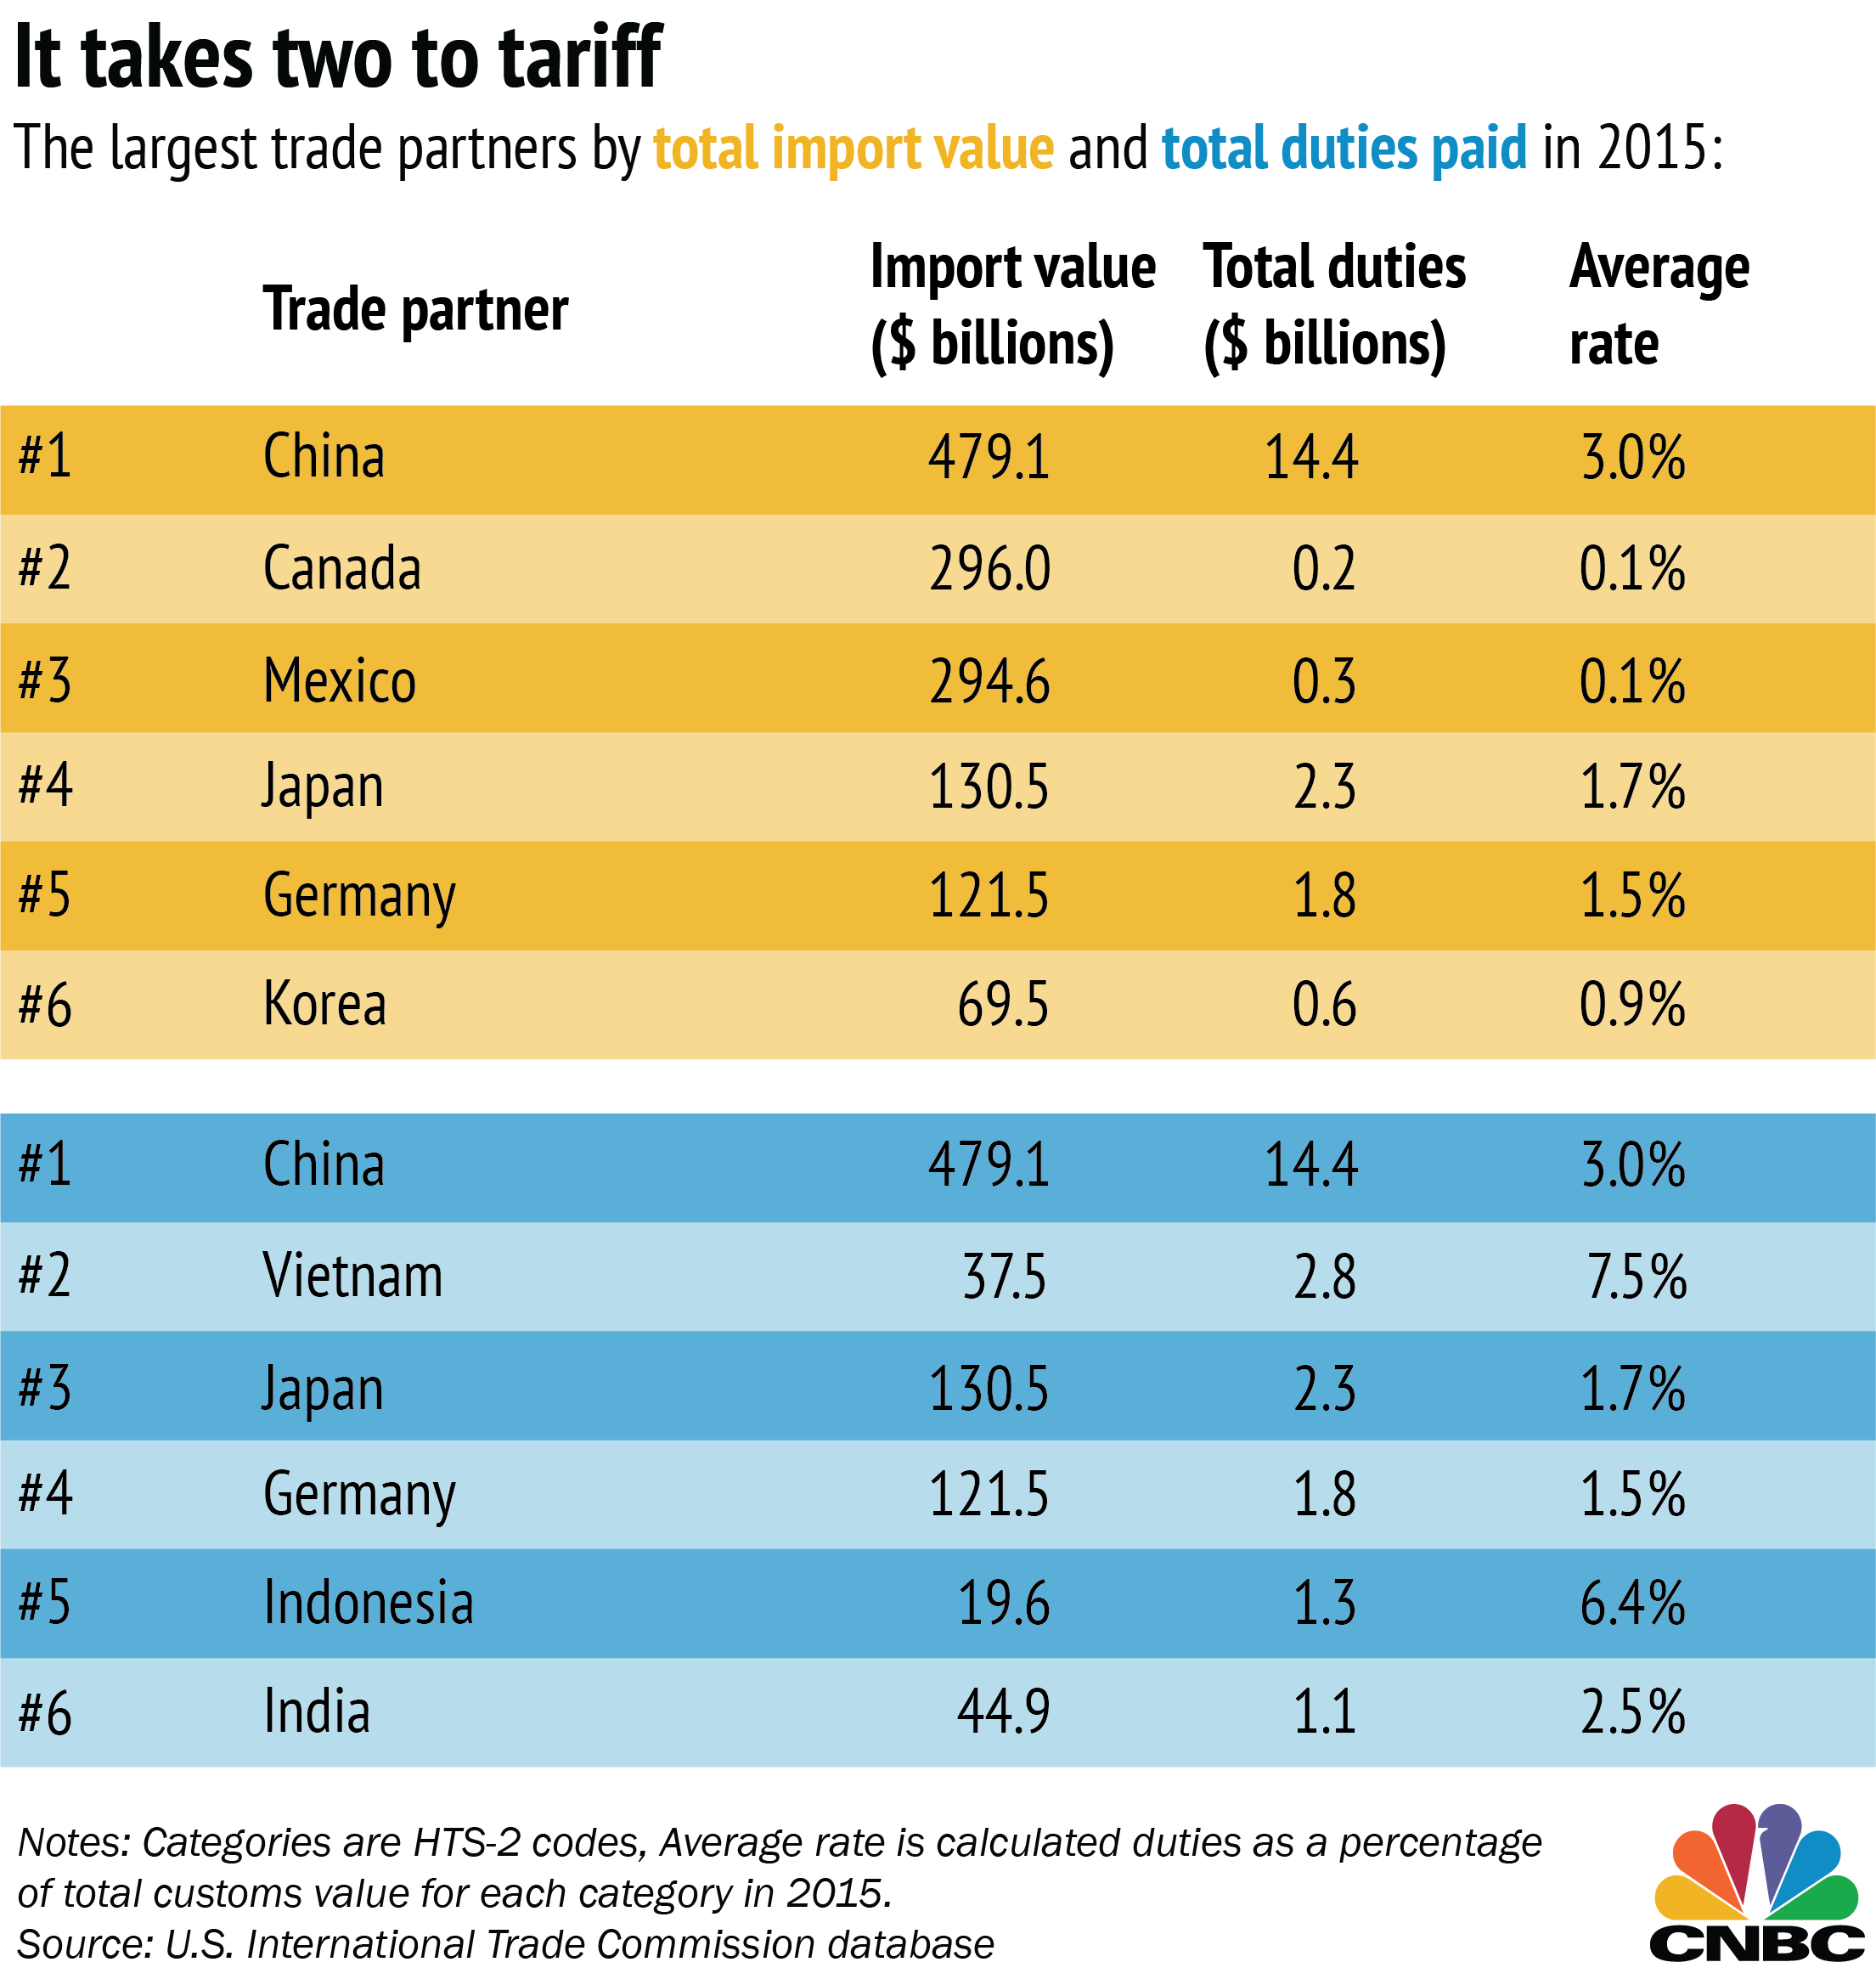
Anyway, tariffs are used for protection of domestic production, consumers, new industries, national security, or for retaliation. When a tariff changes, the price of that product changes... and then it reverberates throughout the supply chain. That is a good chunk of what has been playing out in the markets the past few weeks. As of 2016, China paid 40% of our tariffs, resulting in $14.4 billion in duties paid. Vietnam, Japan, Germany, Indonesia, and India are the next 5 highest tariff payers. As I am writing this, President Trump threatening to place more tariffs on China, and the Dow futures indicate the market will drop at open again. Tariffs played a significant role in the onset of the Great Depression, so reading up on the Smoot-Hawley Tariff Act of 1930 gives some perspective on what tariffs can do to an economy.
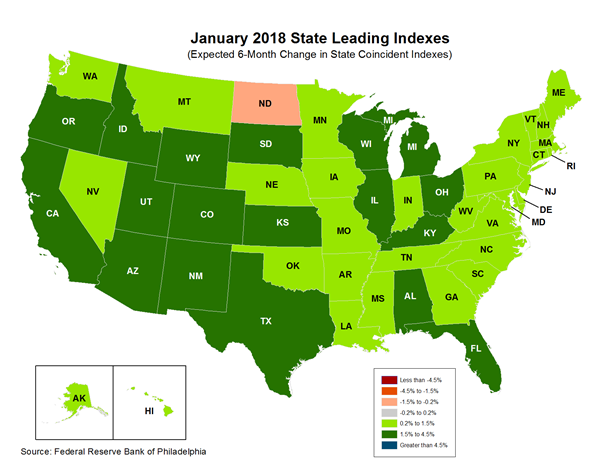
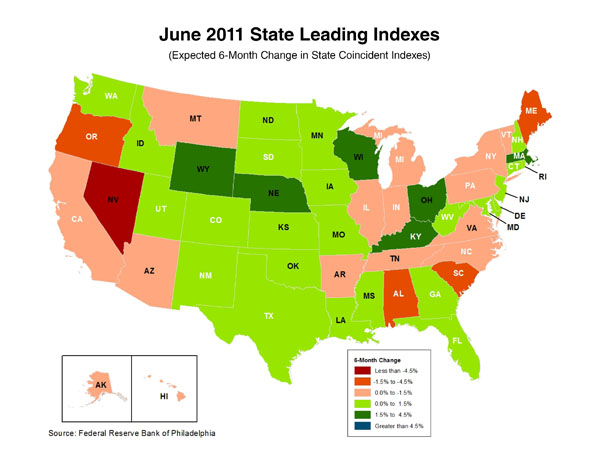
I will close out with a quick look at Regional Economics. The national economic metrics can seem like they gloss over what is happening at the state level, so below is a look at the Federal Reserve of Philadelphia's State Leading Indexes from 2018. The second chart shows the State Leading Indexes from 2011 for comparison. Aside from North Dakota struggling at the moment, states are doing well on their Leading Indicators from sea to shining sea.
Disclosure: This commentary on this website reflects the personal opinions, viewpoints and analyses of the DeDora Capital, Inc. employees providing such comments, and should not be regarded as a description of advisory services provided by DeDora Capital, Inc. or performance returns of any DeDora Capital, Inc. Investments client. The views reflected in the commentary are subject to change at any time without notice. Nothing on this website constitutes investment advice, performance data or any recommendation that any particular security, portfolio of securities, transaction or investment strategy is suitable for any specific person. Any mention of a particular security and related performance data is not a recommendation to buy or sell that security. DeDora Capital, Inc. manages its clients’ accounts using a variety of investment techniques and strategies, which are not necessarily discussed in the commentary. Investments in securities involve the risk of loss. Past performance is no guarantee of future results.